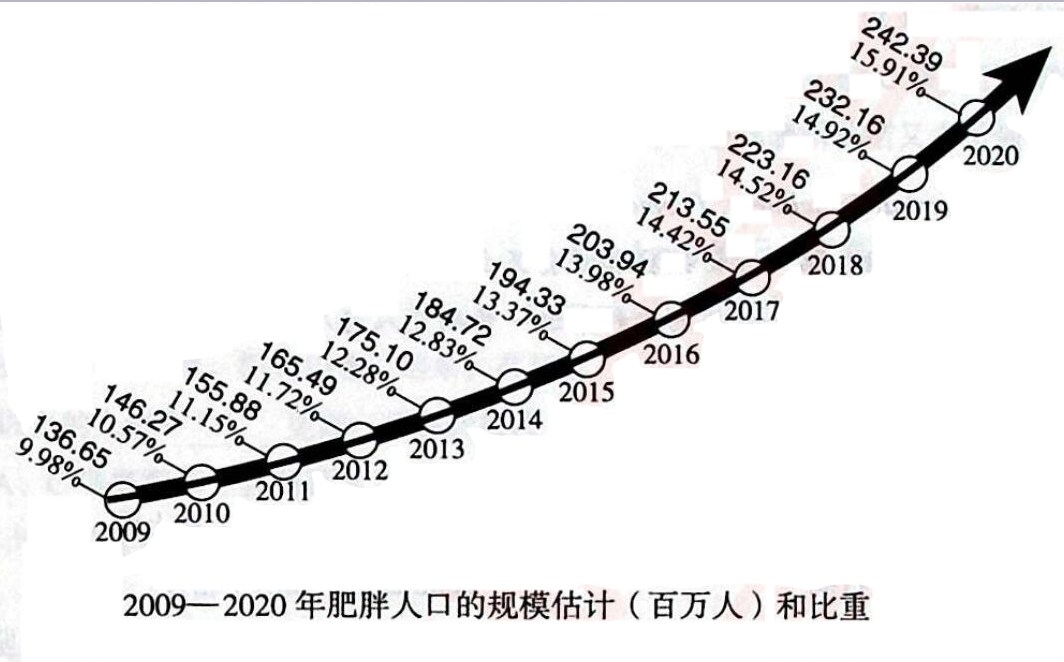
The chart given above reflects the scale and proportion of the obese population between 2009 and 2020.Both the scale and the proportion are on the rise.Several factors,to my way of thinking,can be easily found to account for the phenomenon among which I would like to name three most significant ones as follows.At the first place,obesity is closely related to sugar intake.Sugar can add calories to everything you eat.Second,fast food restaurants are scattered all over the country,you know,fast food is high in calories and fat.Third,computers and games have bad effect on obesity,but their effect is less pronounced.It's a good idea to limit your computer,games and TV time to less than two hours a day.To conclude,such a trend will probably develop more dramatically in the future.Therefore,it is wise to take some measures to reverse such trend,and to keep healthy.